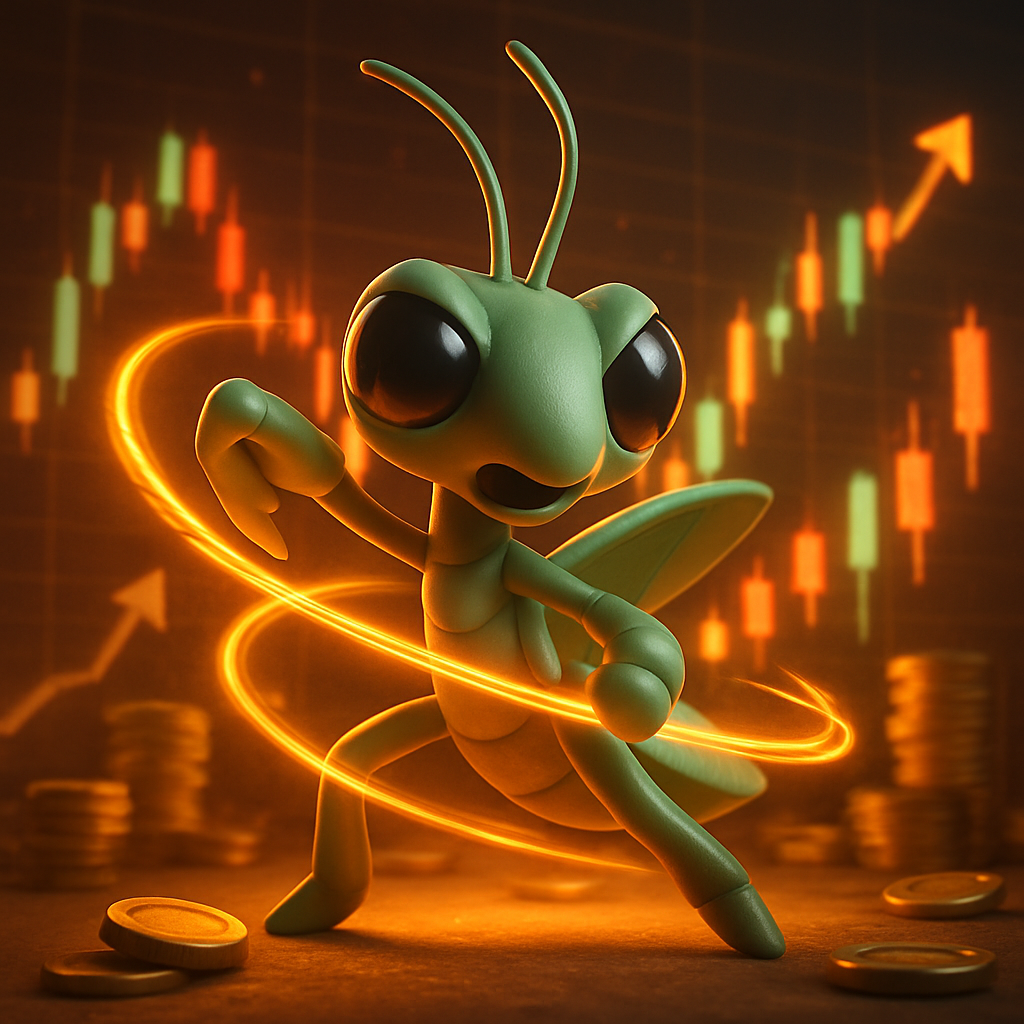
Edge Mantis
A collectible critter in the spirit of Edward Thorp · 1960s–2000s
A critter in the spirit of Edward Thorp, the mathematician who wrote 'Beat the Dealer' on blackjack card counting and 'Beat the Market,' then ran the quant fund Princeton/Newport. Inspired by his hedged, probability-based approach and early work on options and convertible arbitrage. Educational inspiration only.
What a player learnsSize your bets to the edge and the risk of ruin, not your hopes.
Sell options against holdings to collect premium as a recurring income stream.
Options-income strategies sell options to collect the premium buyers pay. The classic covered call means owning a stock and selling a call against it: you pocket the premium, and if the stock stays below the strike, you keep both shares and cash. Cash-secured puts work similarly on the buy side. The seller is effectively renting out upside or agreeing to buy lower, earning steady income in flat or mildly rising markets. It monetizes the tendency of options to be priced slightly rich (the volatility risk premium). The catch is asymmetry: you cap your gains while keeping most of the downside, so a big rally or crash hurts.
Strengths
- Generates steady income in flat or range-bound markets
- Covered calls lower cost basis and cushion small drops
- Monetizes the persistent volatility risk premium
Trade-offs
- Caps upside: you forfeit big rallies for a small premium
- Keeps most of the downside if the stock crashes
- Assignment, tax, and complexity risks for beginners
| Ticker | Company | Weight | Window | Path |
|---|---|---|---|---|
⚡ TSLA | Tesla Electric cars, batteries, solar, and self-driving software. | 27% | ▼ −11.0% | |
🎮 NVDA | NVIDIA Designs the chips (GPUs) that power video games and — hugely — AI. | 23% | ▲ +4.8% | |
🏢 FCX | Freeport-McMoRan Freeport-McMoRan supplies the raw materials everything is made from. | 20% | ▲ +15.4% | |
🎬 NFLX | Netflix The streaming service that helped end cable TV. | 16% | ▲ +4.9% | |
🏢 BA | Boeing Boeing builds the machines and infrastructure behind the economy. | 14% | ▲ +4.6% |
🦗 Edge Mantis ran a options style book this window. It returned +2.2% (+0.5% vs SPY), with a Sharpe of 1.16 and a -4.2% worst dip. True to its discipline, it sold patience for a steady premium. Discipline over drama — this describes the critter's process and result, not the merit of any company. Simulated · educational · not investment advice.
Recruit the Edge Mantis style in Conviction League
Draft a critter that trades in this spirit, train it on a simulated market, and climb the leaderboard — free and fully simulated, so there's zero real-money risk.
Prices are simulated by a factor model; tickers are real large-caps used for familiarity only. Returns shown are raw window totals over a ~1-month fixture; Sharpe/Sortino/vol are annualized ratios.