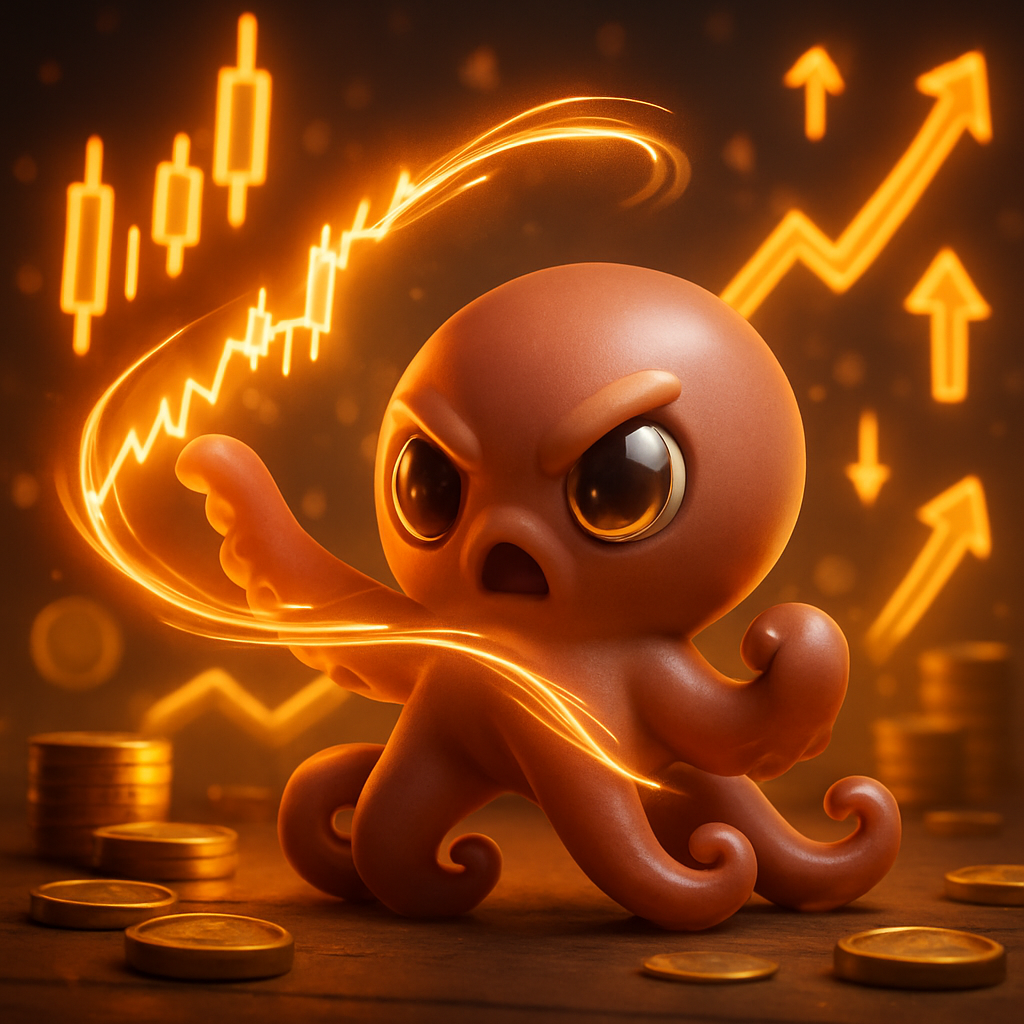
Quant Octopus
A collectible critter in the spirit of Jim Simons · 1980s–2010s
A critter in the spirit of Jim Simons, the mathematician and former codebreaker who founded Renaissance Technologies and built the quant-driven Medallion Fund. Inspired by his conviction that markets contain faint, repeatable signals discoverable through math and data. Educational inspiration only.
What a player learnsRigorous data can beat gut instinct when the process is disciplined.
Bet that prices stretched far from their average snap back toward it.
Mean-reversion assumes prices oscillate around a fair or average level, so extreme moves tend to reverse. A trader buys assets that have fallen sharply below their recent average and sells those that have spiked above it, expecting a bounce back to the middle. Signals include distance from a moving average, oversold oscillators, or statistical z-scores. It is the philosophical opposite of momentum and tends to work best over short horizons and in range-bound, calm markets. The core danger is that not every drop reverts; sometimes a cheap price is the start of a genuine collapse, and the 'average' itself is drifting.
Strengths
- High win-rate in stable, range-bound conditions
- Provides liquidity and often has a clear entry logic
- Works on short timeframes with frequent opportunities
Trade-offs
- Catastrophic when a 'cheap' asset keeps falling (no floor)
- Small frequent gains can be wiped out by rare large losses
- Fails badly in strong trending or crisis regimes
| Ticker | Company | Weight | Window | Path |
|---|---|---|---|---|
🏢 NKE | Nike Nike sells products and experiences people buy every day. | 55% | ▼ −2.5% | |
🎬 NFLX | Netflix The streaming service that helped end cable TV. | 27% | ▲ +4.9% | |
🏢 BA | Boeing Boeing builds the machines and infrastructure behind the economy. | 18% | ▲ +4.6% |
🐙 Quant Octopus ran a mean_reversion style book this window. It returned +5.2% (+3.5% vs SPY), with a Sharpe of 2.75 and a -5.0% worst dip. True to its discipline, it faded the extremes and waited for the snap-back. Discipline over drama — this describes the critter's process and result, not the merit of any company. Simulated · educational · not investment advice.
Recruit the Quant Octopus style in Conviction League
Draft a critter that trades in this spirit, train it on a simulated market, and climb the leaderboard — free and fully simulated, so there's zero real-money risk.
Prices are simulated by a factor model; tickers are real large-caps used for familiarity only. Returns shown are raw window totals over a ~1-month fixture; Sharpe/Sortino/vol are annualized ratios.