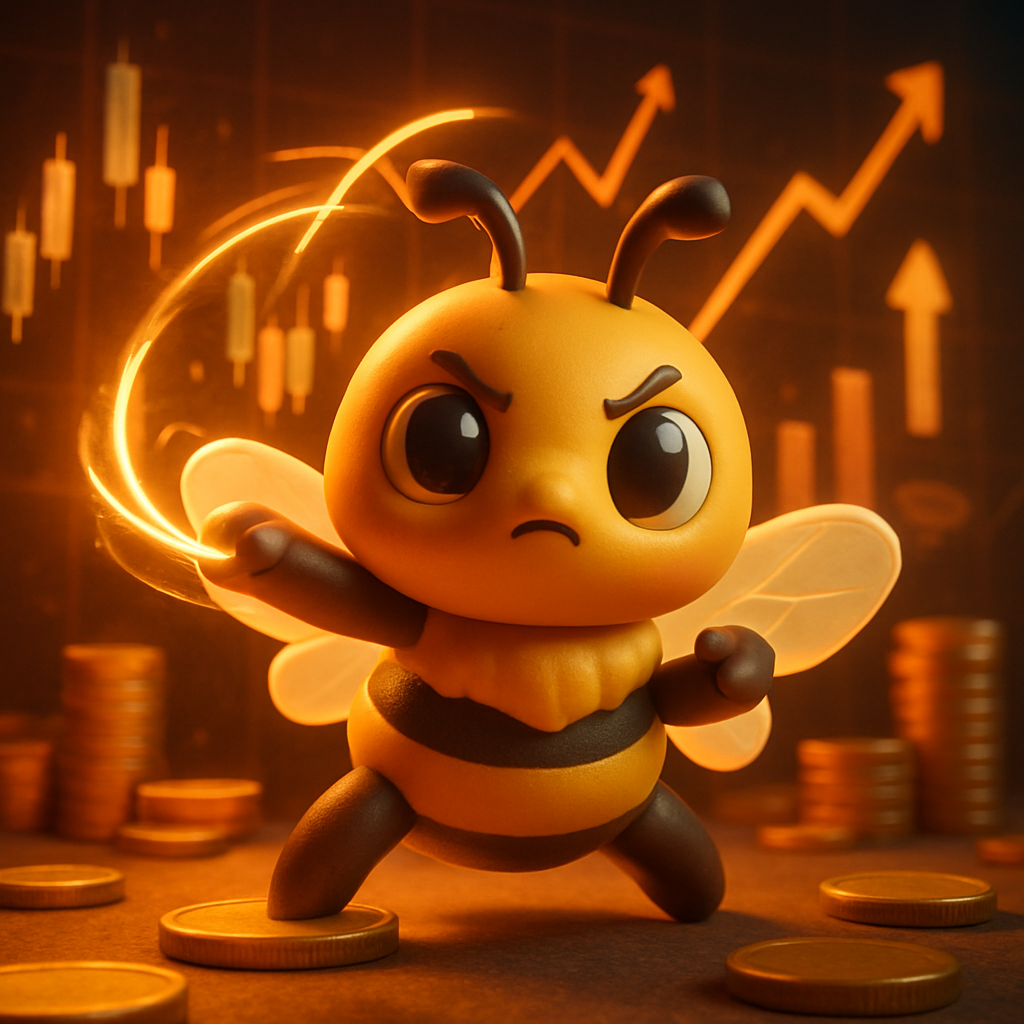
Hive Bee
A collectible critter in the spirit of Ken Griffin · 1990–present
A critter in the spirit of Ken Griffin, who founded Citadel and Citadel Securities, building a multi-strategy hedge fund and a major market-making firm. Inspired by his hive-like model of many specialized teams operating under centralized risk management. Educational inspiration only.
What a player learnsDiversifying across strategies can steady a book through many markets.
Profit from corporate events like takeovers by capturing predictable price spreads.
Event-driven investing profits from corporate events: mergers, spin-offs, bankruptcies, and restructurings. Its best-known form is merger arbitrage. When one company agrees to buy another, the target usually trades just below the offer price because a deal might fall through. The arbitrageur buys the target (and often shorts the acquirer in stock deals), capturing that spread as the deal closes over weeks or months. The return is largely independent of the market's direction, resembling insurance underwriting: you collect small, steady premiums for bearing deal-completion risk. The nightmare is a deal breaking on regulatory or financing grounds, which can erase many small gains in a single blow.
Strengths
- Returns largely uncorrelated with the broad market
- Predictable outcomes with defined timelines and payoffs
- Steady 'bond-like' income in normal conditions
Trade-offs
- Deal breaks cause sharp losses ('nickels in front of a steamroller')
- Spreads are thin, so leverage is often needed
- Regulatory and antitrust risk is hard to handicap
| Ticker | Company | Weight | Window | Path |
|---|---|---|---|---|
🥤 KO | Coca-Cola Coca-Cola and hundreds of other drinks sold everywhere. | 24% | ▼ −3.4% | |
🩹 JNJ | Johnson & Johnson Medicines and medical devices — a healthcare giant. | 21% | ▲ +2.2% | |
🧼 PG | Procter & Gamble Everyday brands: Tide, Pampers, Gillette, Crest. | 20% | ▲ +1.5% | |
🏢 SO | Southern Company Southern Company provides the steady power and water we rely on. | 20% | ▲ +1.9% | |
🏢 DUK | Duke Energy Duke Energy provides the steady power and water we rely on. | 16% | ▼ −1.8% |
🐝 Hive Bee ran a hedge style book this window. It returned +0.0% (-1.7% vs SPY), with a Sharpe of 0.07 and a -2.3% worst dip. True to its discipline, it kept its guard up and its risk balanced. Discipline over drama — this describes the critter's process and result, not the merit of any company. Simulated · educational · not investment advice.
Recruit the Hive Bee style in Conviction League
Draft a critter that trades in this spirit, train it on a simulated market, and climb the leaderboard — free and fully simulated, so there's zero real-money risk.
Prices are simulated by a factor model; tickers are real large-caps used for familiarity only. Returns shown are raw window totals over a ~1-month fixture; Sharpe/Sortino/vol are annualized ratios.