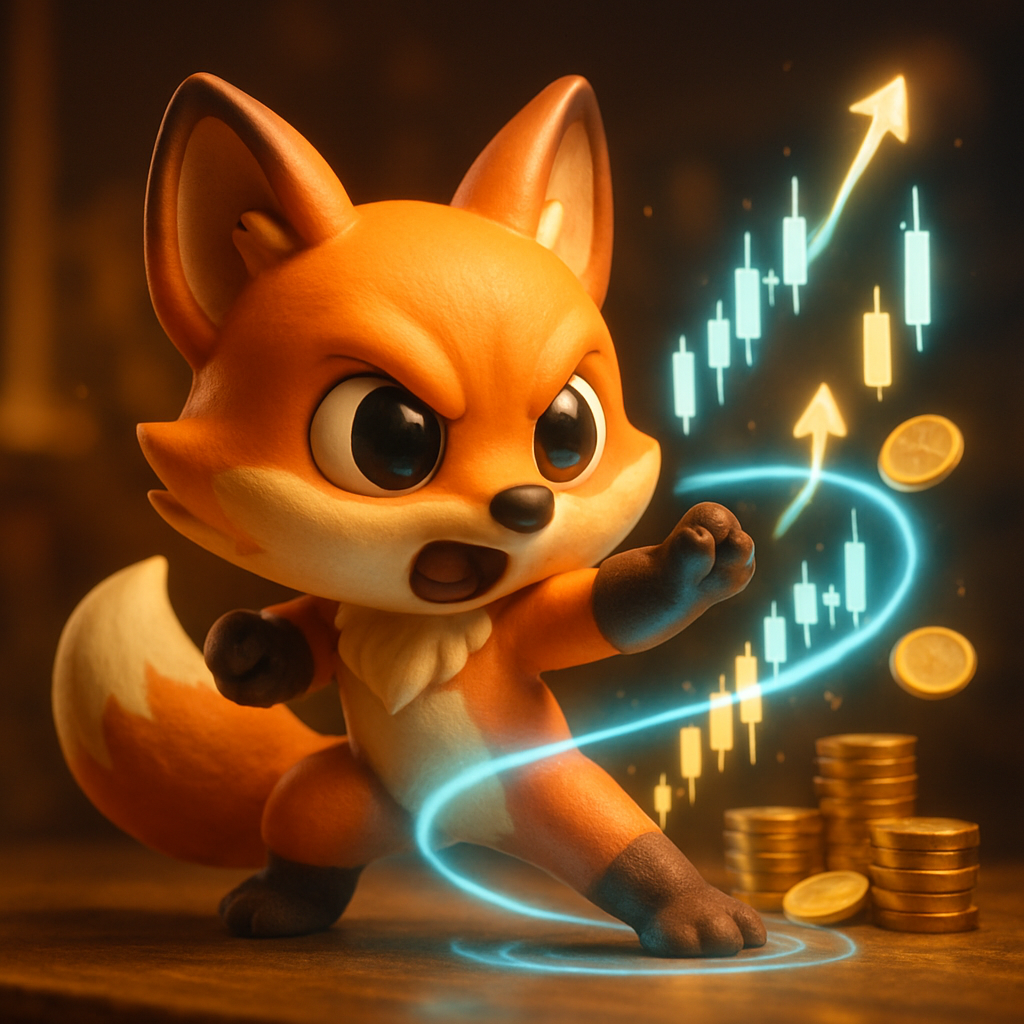
Forager Fox
A collectible critter in the spirit of Peter Lynch · 1977–1990
A critter in the spirit of Peter Lynch, who ran Fidelity's Magellan Fund to roughly 29% annualized returns over 13 years and wrote 'One Up on Wall Street.' Inspired by his ground-level curiosity and knack for spotting growing businesses in daily life. Educational inspiration only.
What a player learnsUnderstand what a company actually does before you own it.
Buy assets trading below your estimate of their intrinsic worth, and wait.
Value investing buys assets that look cheap relative to fundamentals: earnings, cash flow, book value, or assets. The premise, rooted in Graham and Dodd, is that markets over-punish out-of-favor companies, creating a 'margin of safety' between price and intrinsic value that eventually closes. Investors do bottom-up analysis of balance sheets and business quality, then hold patiently for the market to re-rate the stock. It is inherently contrarian, requiring you to buy what others are selling. As a factor, cheapness is measured with ratios and applied across a diversified basket rather than a single deep-dive, but the underlying bet is the same.
Strengths
- Long, well-documented historical premium over decades
- Margin of safety cushions downside
- Forces disciplined, fundamentals-based thinking
Trade-offs
- 'Value traps': cheap stocks that stay cheap or go bankrupt
- Can underperform growth for a decade-plus (e.g. 2010s)
- Requires painful patience and contrarian conviction
| Ticker | Company | Weight | Window | Path |
|---|---|---|---|---|
🧼 PG | Procter & Gamble Everyday brands: Tide, Pampers, Gillette, Crest. | 43% | ▲ +1.5% | |
🏢 BRK.B | Berkshire Hathaway Berkshire Hathaway helps money move, grow, and stay safe. | 37% | ▲ +10.3% | |
🏢 SO | Southern Company Southern Company provides the steady power and water we rely on. | 20% | ▲ +1.9% |
🦊 Forager Fox ran a factor style book this window. It returned +3.9% (+2.2% vs SPY), with a Sharpe of 3.92 and a -2.7% worst dip. True to its discipline, it blended its factors and stayed diversified. Discipline over drama — this describes the critter's process and result, not the merit of any company. Simulated · educational · not investment advice.
Recruit the Forager Fox style in Conviction League
Draft a critter that trades in this spirit, train it on a simulated market, and climb the leaderboard — free and fully simulated, so there's zero real-money risk.
Prices are simulated by a factor model; tickers are real large-caps used for familiarity only. Returns shown are raw window totals over a ~1-month fixture; Sharpe/Sortino/vol are annualized ratios.